Engage stakeholders
in ways you couldn’t do before.
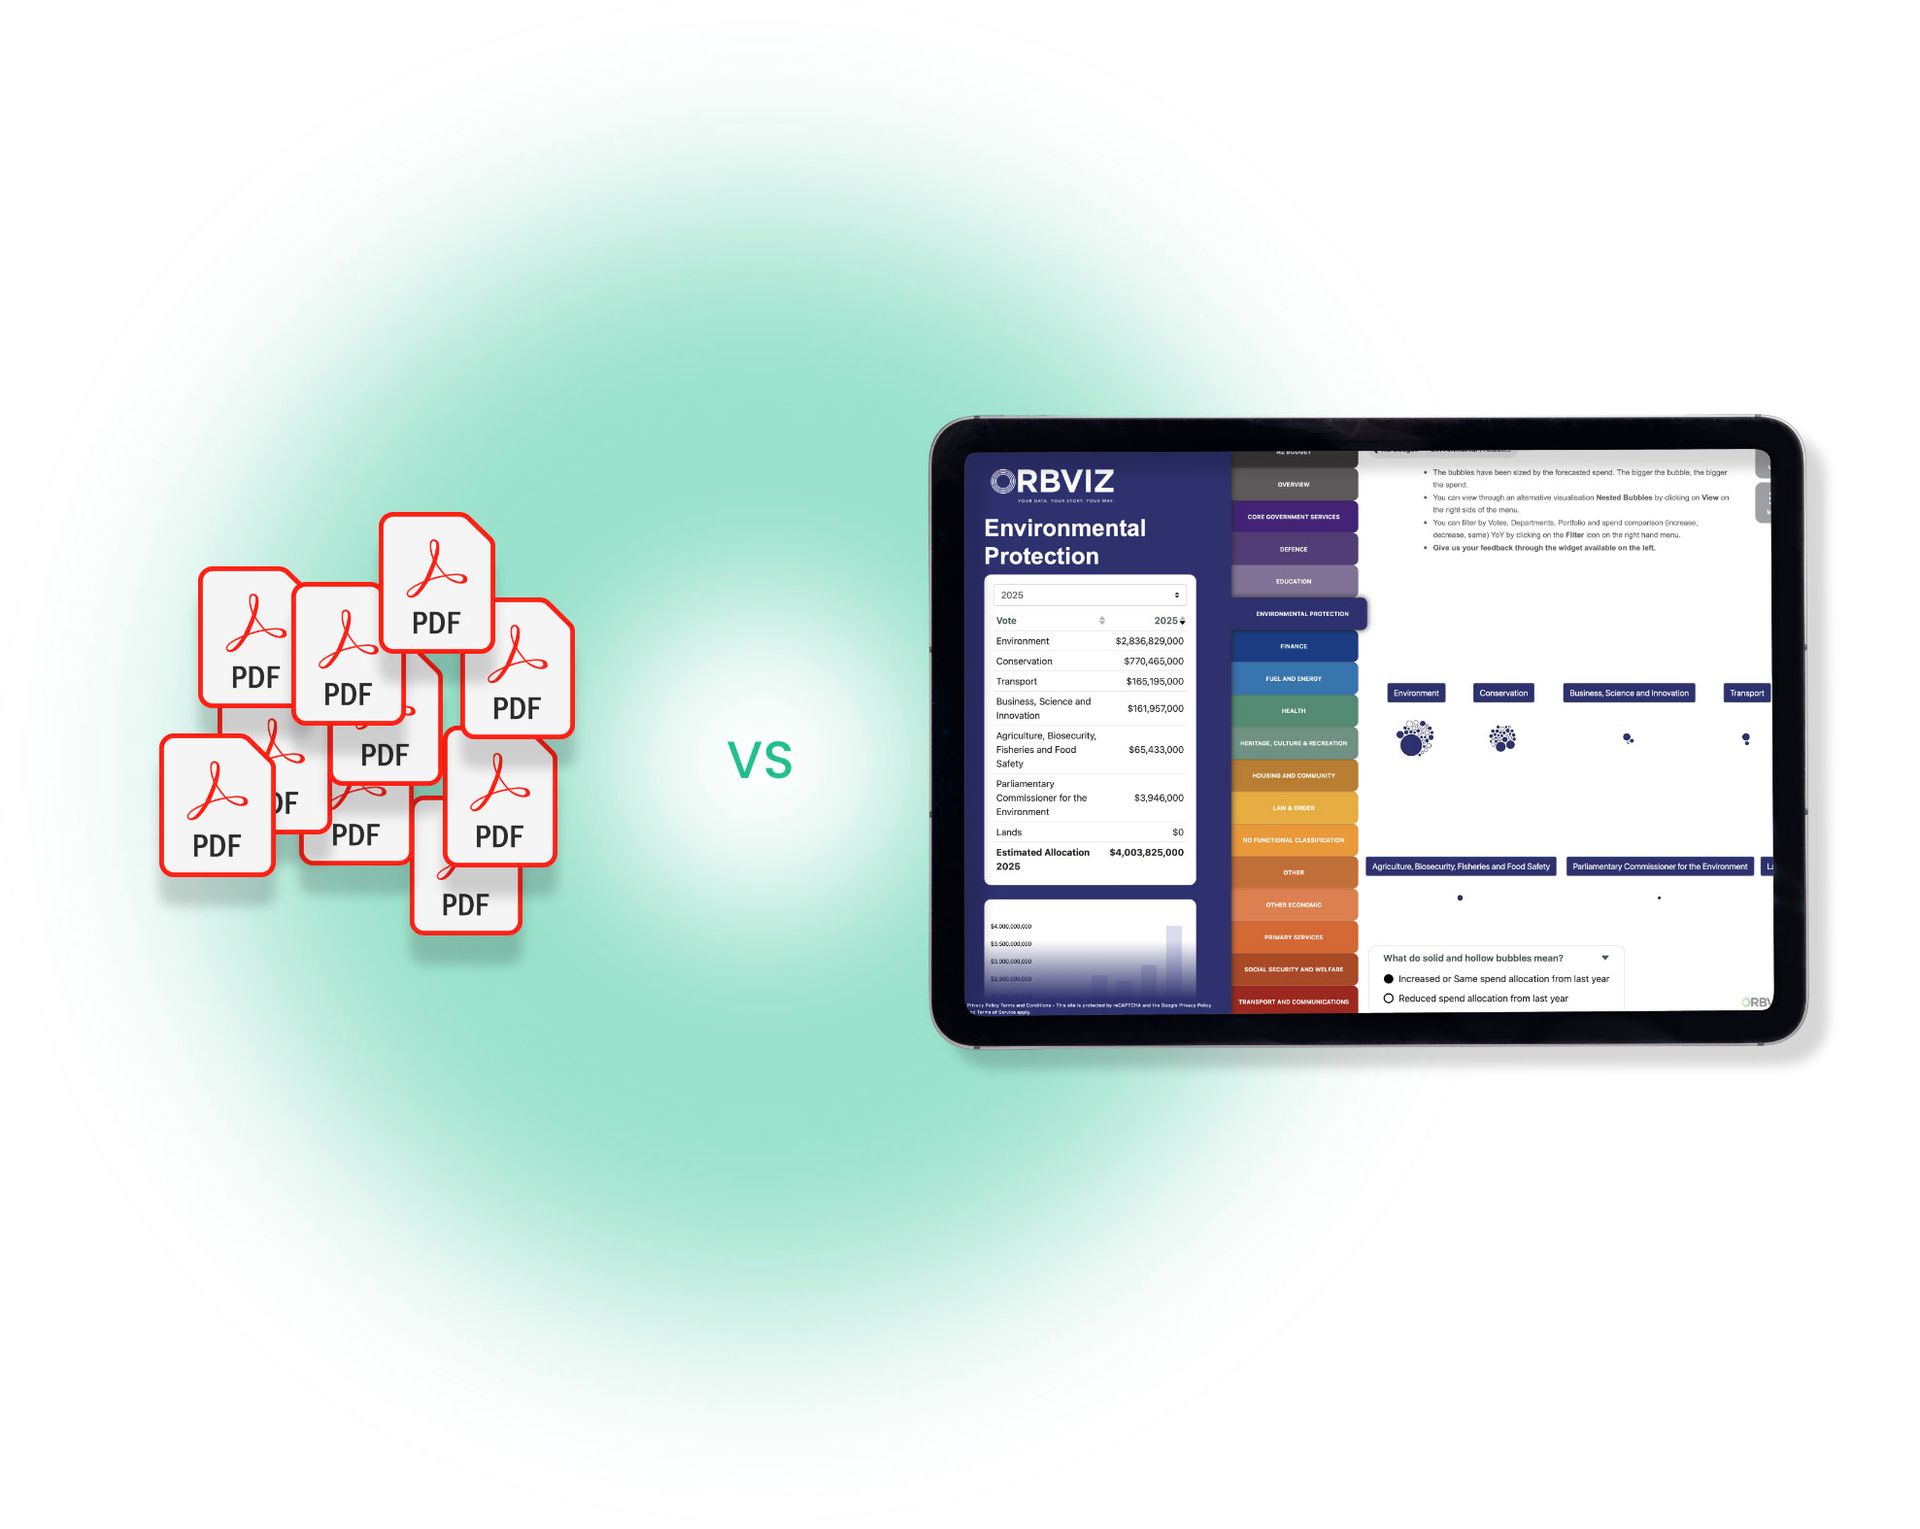
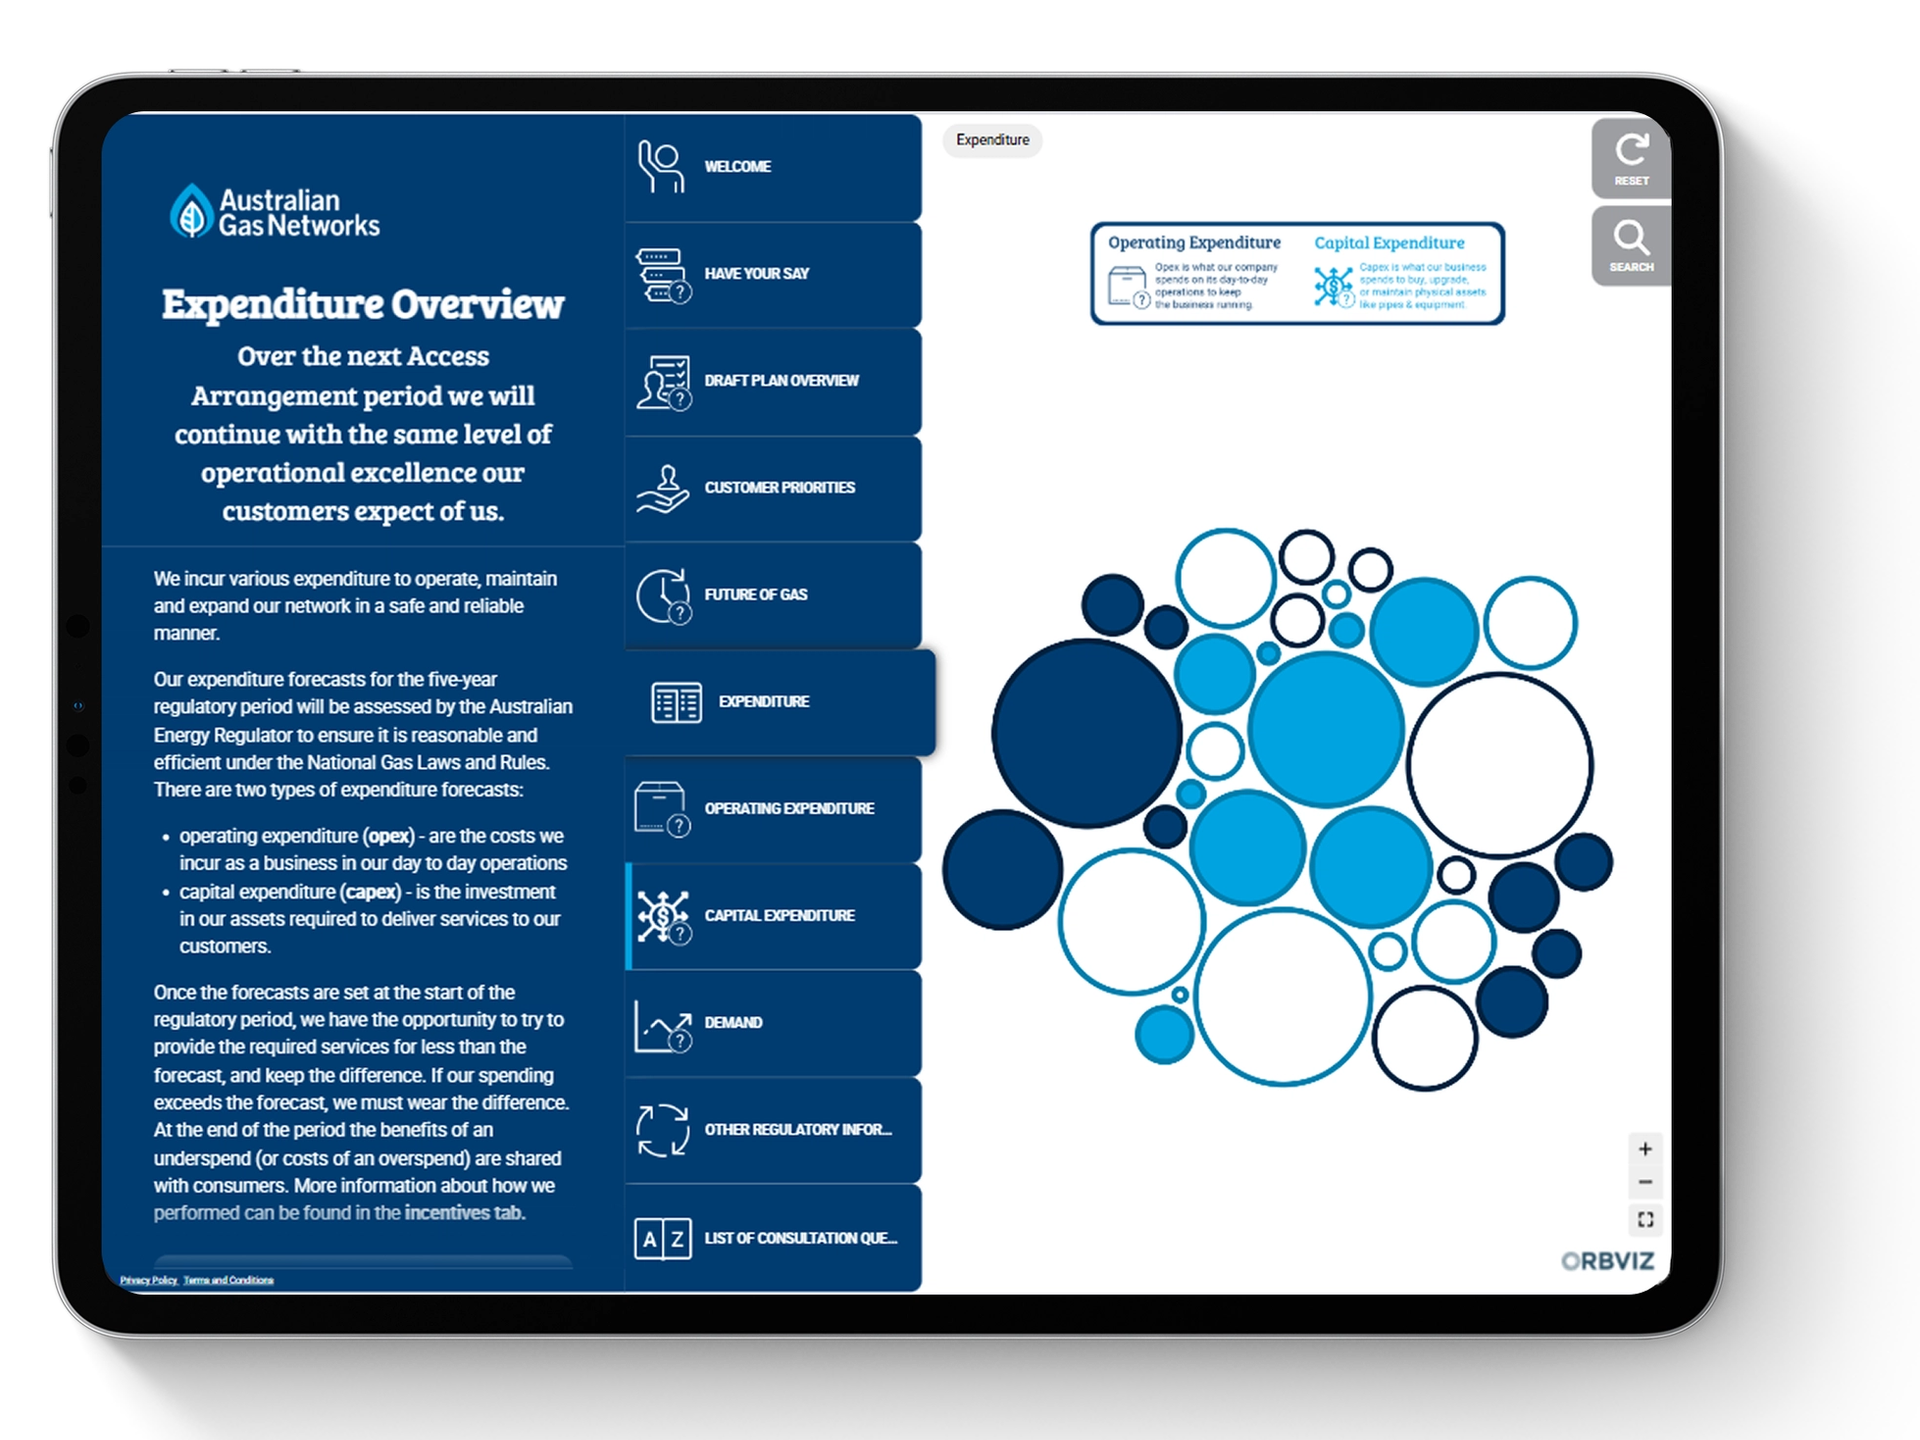
Transform your static reports and spreadsheets into interactive reports that stakeholders can easily access, explore, understand, and respond to.
Trusted by Corporate and Government Innovators
Lucy Huxter, Australian Gas Infrastructure Group
“Their innovative approach transforms complex data into interactive, engaging reports that are easy for everyone to access and understand.”
Some organisations we’ve helped:


From reports to results, in ways you couldn't do before
Total Report Submissions
775
%
INCREASE
From 800 submissions to 7,000 in just one year.
Total Report Views
30
K
VIEWS
Over 30,000 unique views on a single report.
Customer NPS Score
100
NPS
You lead the storytelling, and we provide the dedicated support to make every step of the journey extraordinary.
Engagement Increase
5000
%
INCREASE
Over 5000% increase in engagement over PDF reports.
OrbViz makes building and updating reports, effortless.
1. Drag & drop your data
2. Add your branding
3. Share your report
4. Review engagement analytics
OrbViz modules and templates
Explore our out-of-the-box templates, or create your own
Use Case 1:
Finance
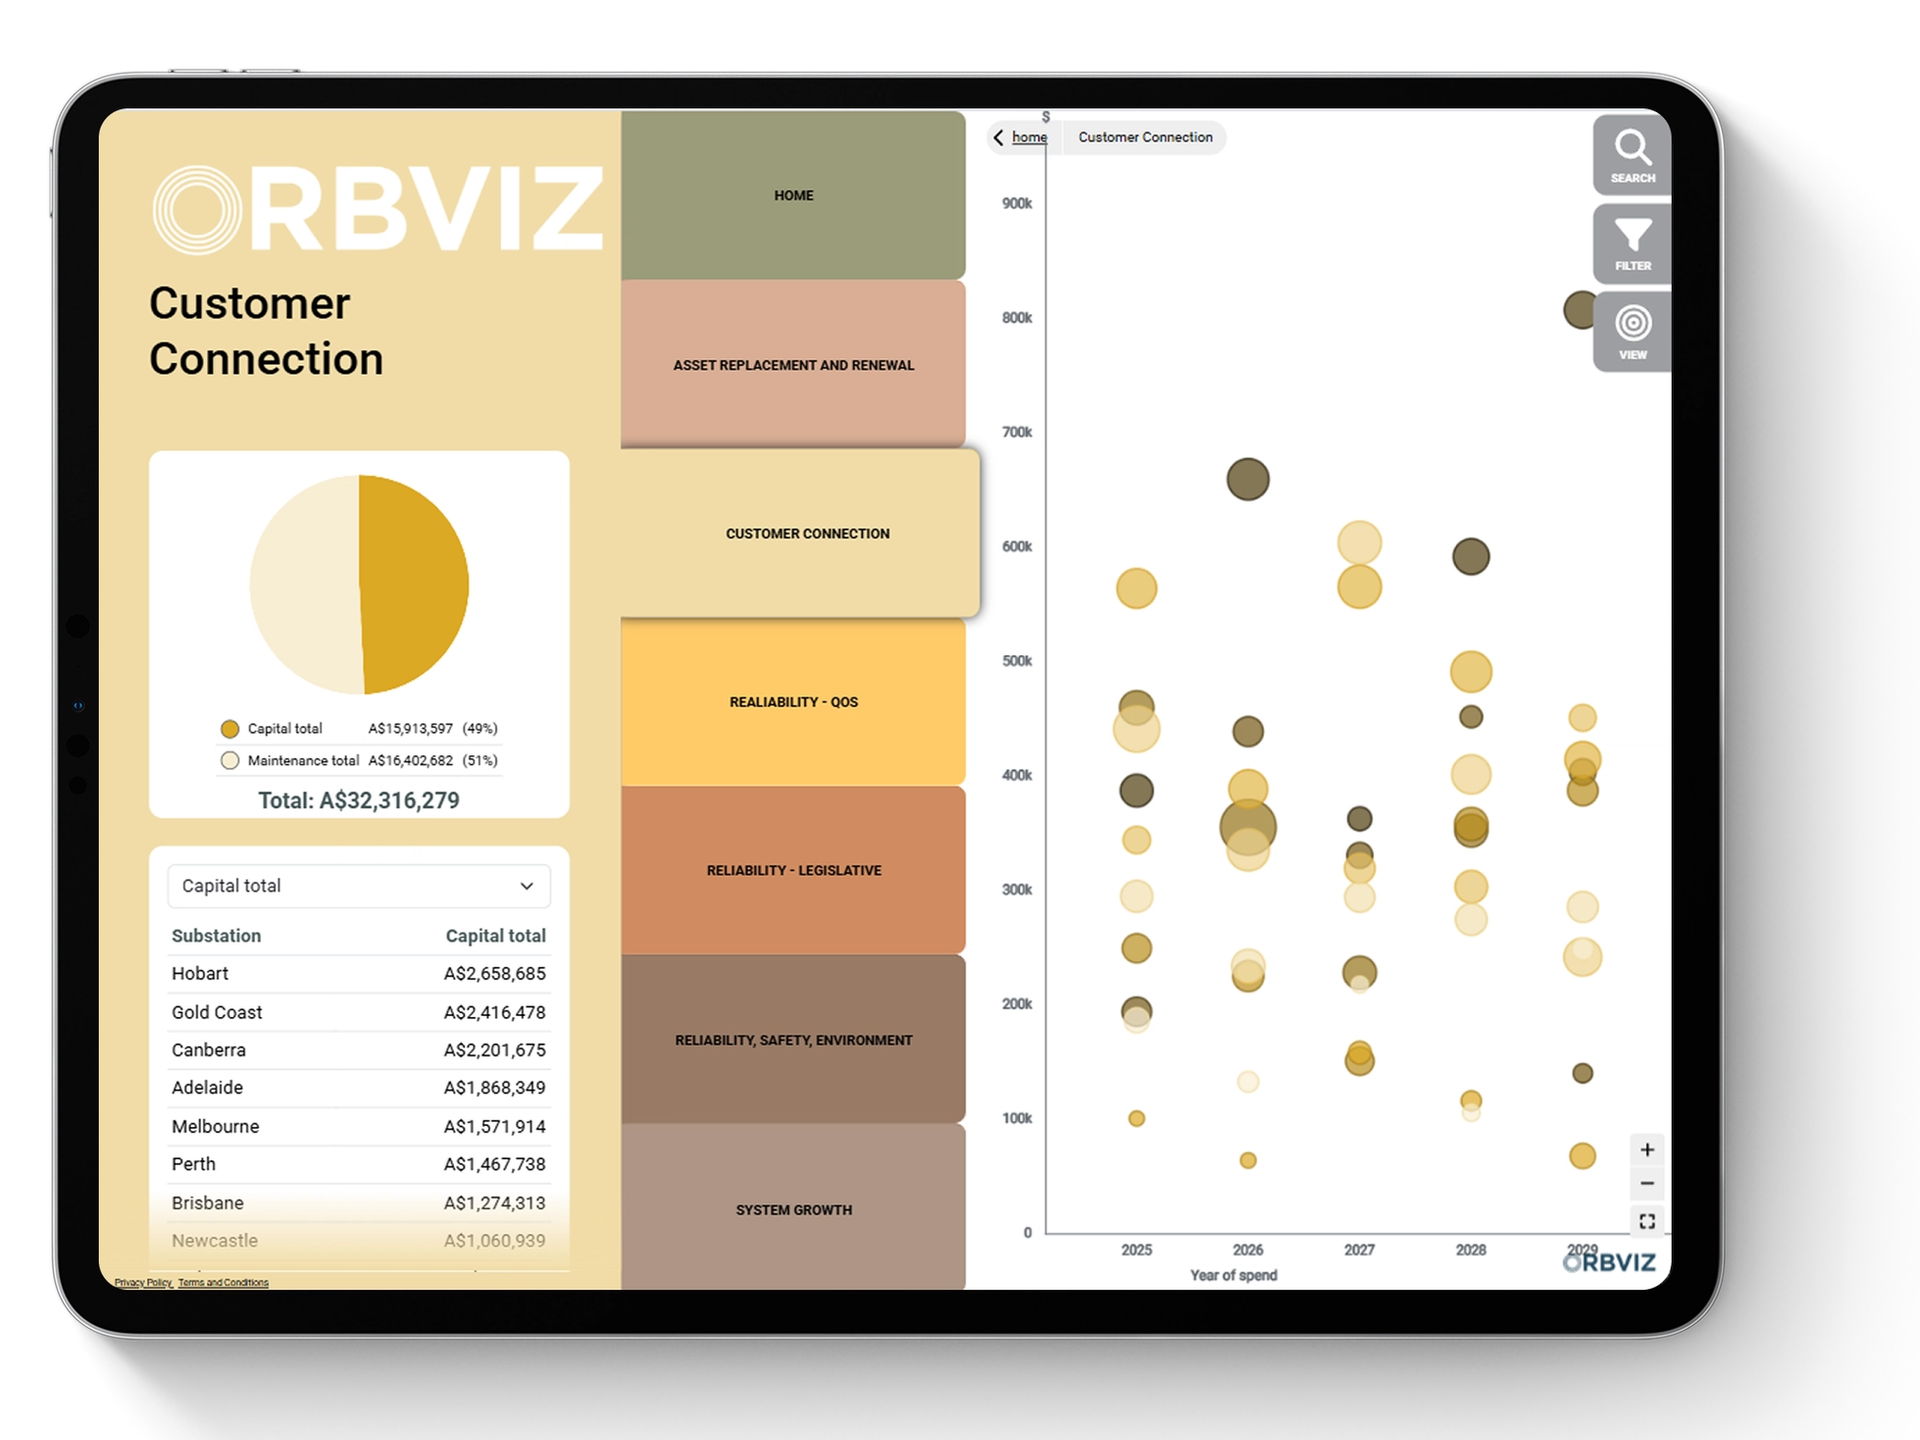
From line items to narratives
Set, review and get feedback on budgets at lightning speed. Transform hundreds of line items into clever, personalised insights that engage stakeholders and gather feedback.
Use Case 2:
ESG
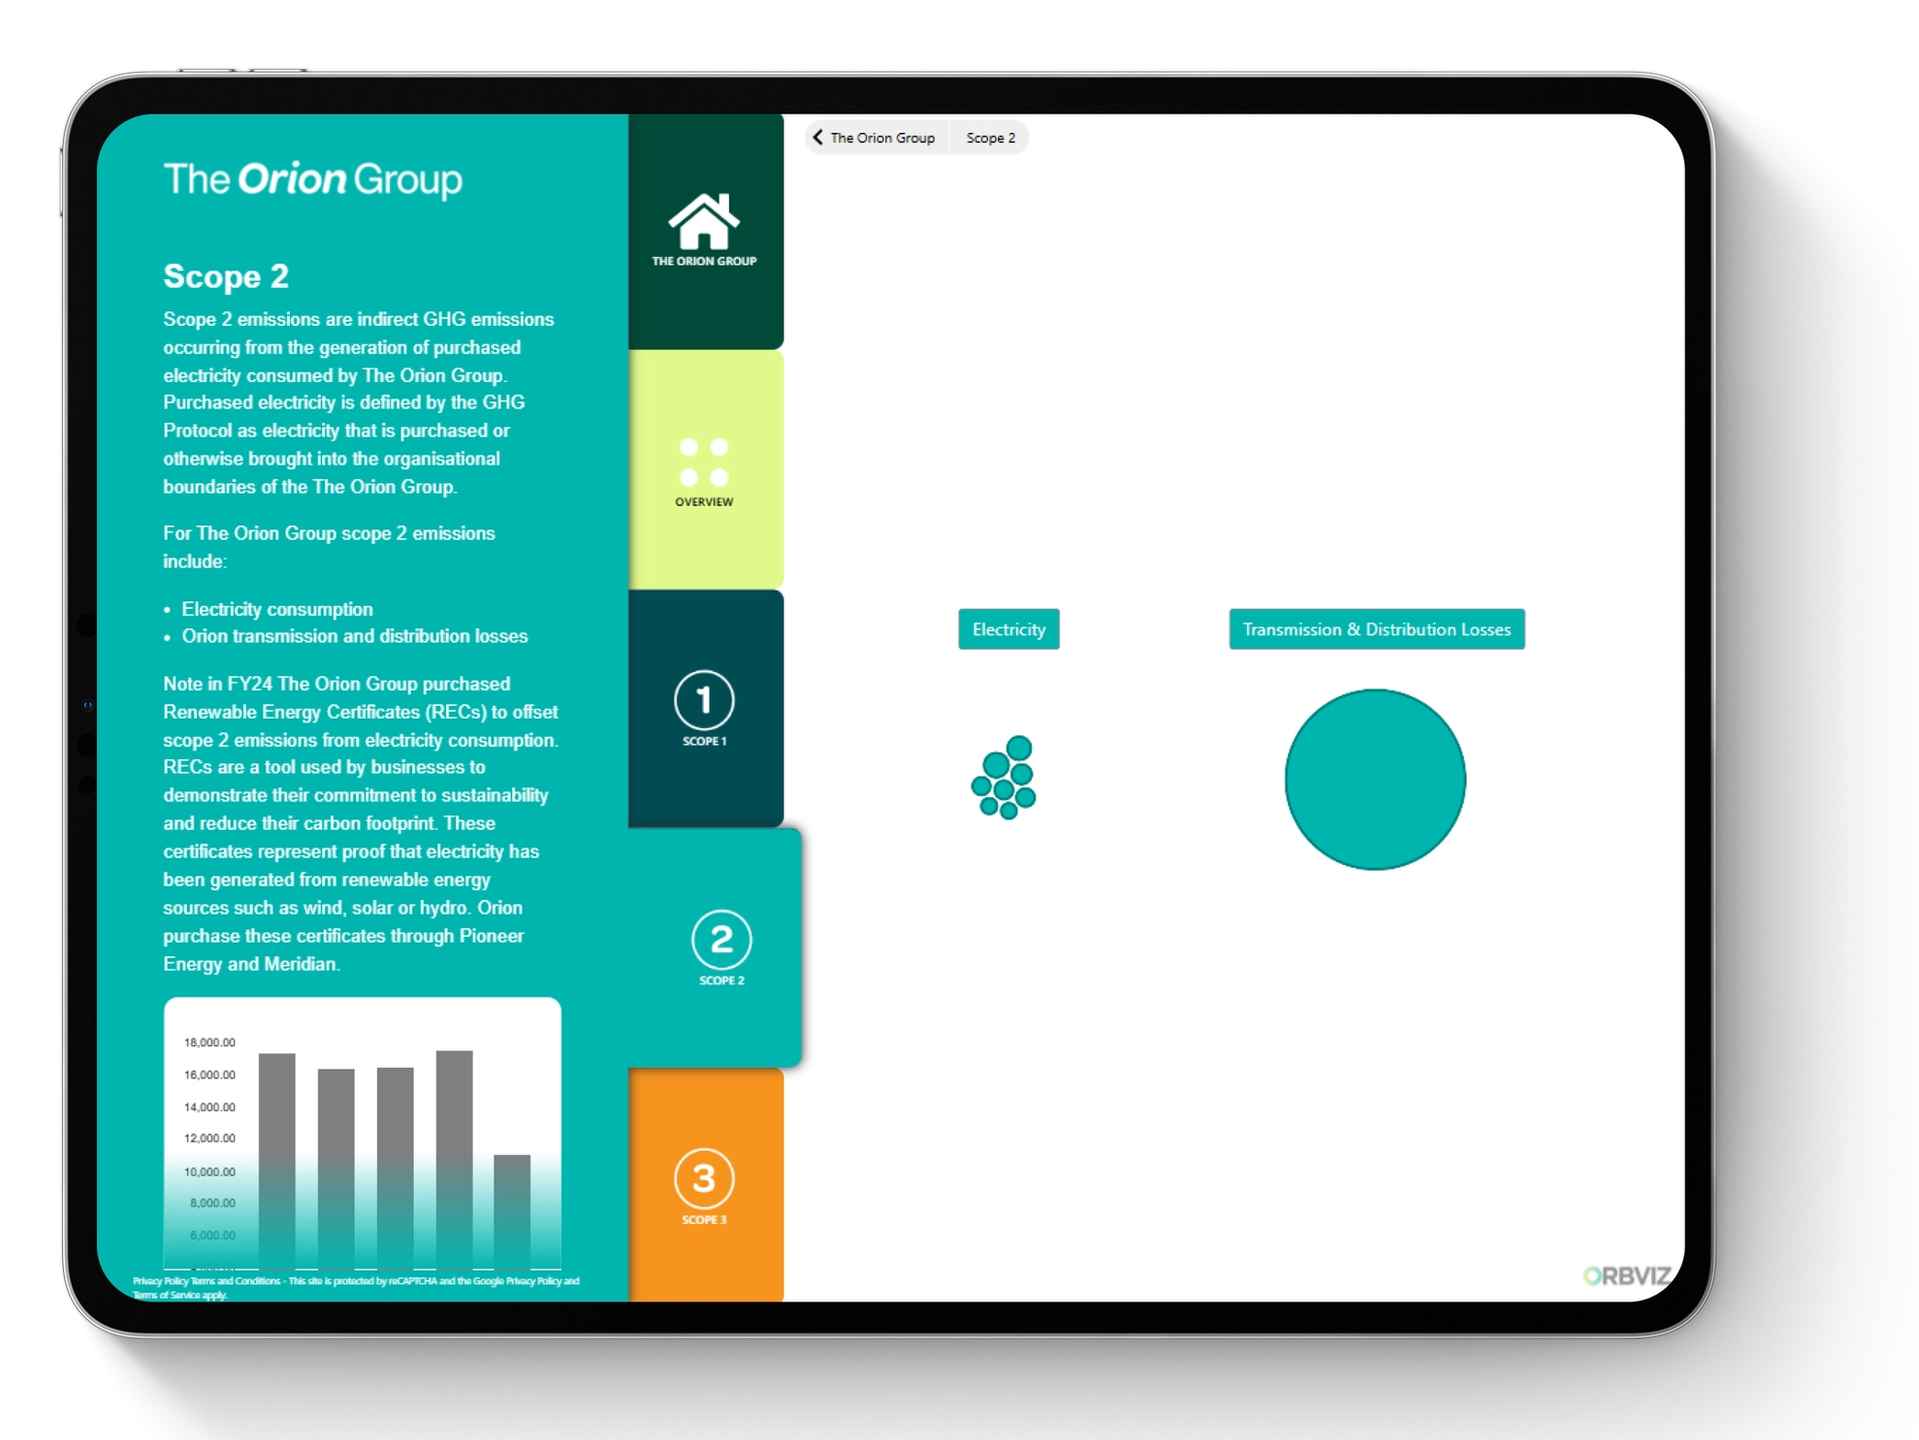
From risk to reward
Communicate your complex ESG data in an interactive, easy-to-understand format that diverse stakeholders can trust and engage with.
Use Case 3:
Sales

From complexity to clarity
Make up-to-the-minute, data-informed decisions by accessing customisable insights across your CRM. Provide a concierge customer experience through interactive report presentations with customer data.
Use Case 4:
Project
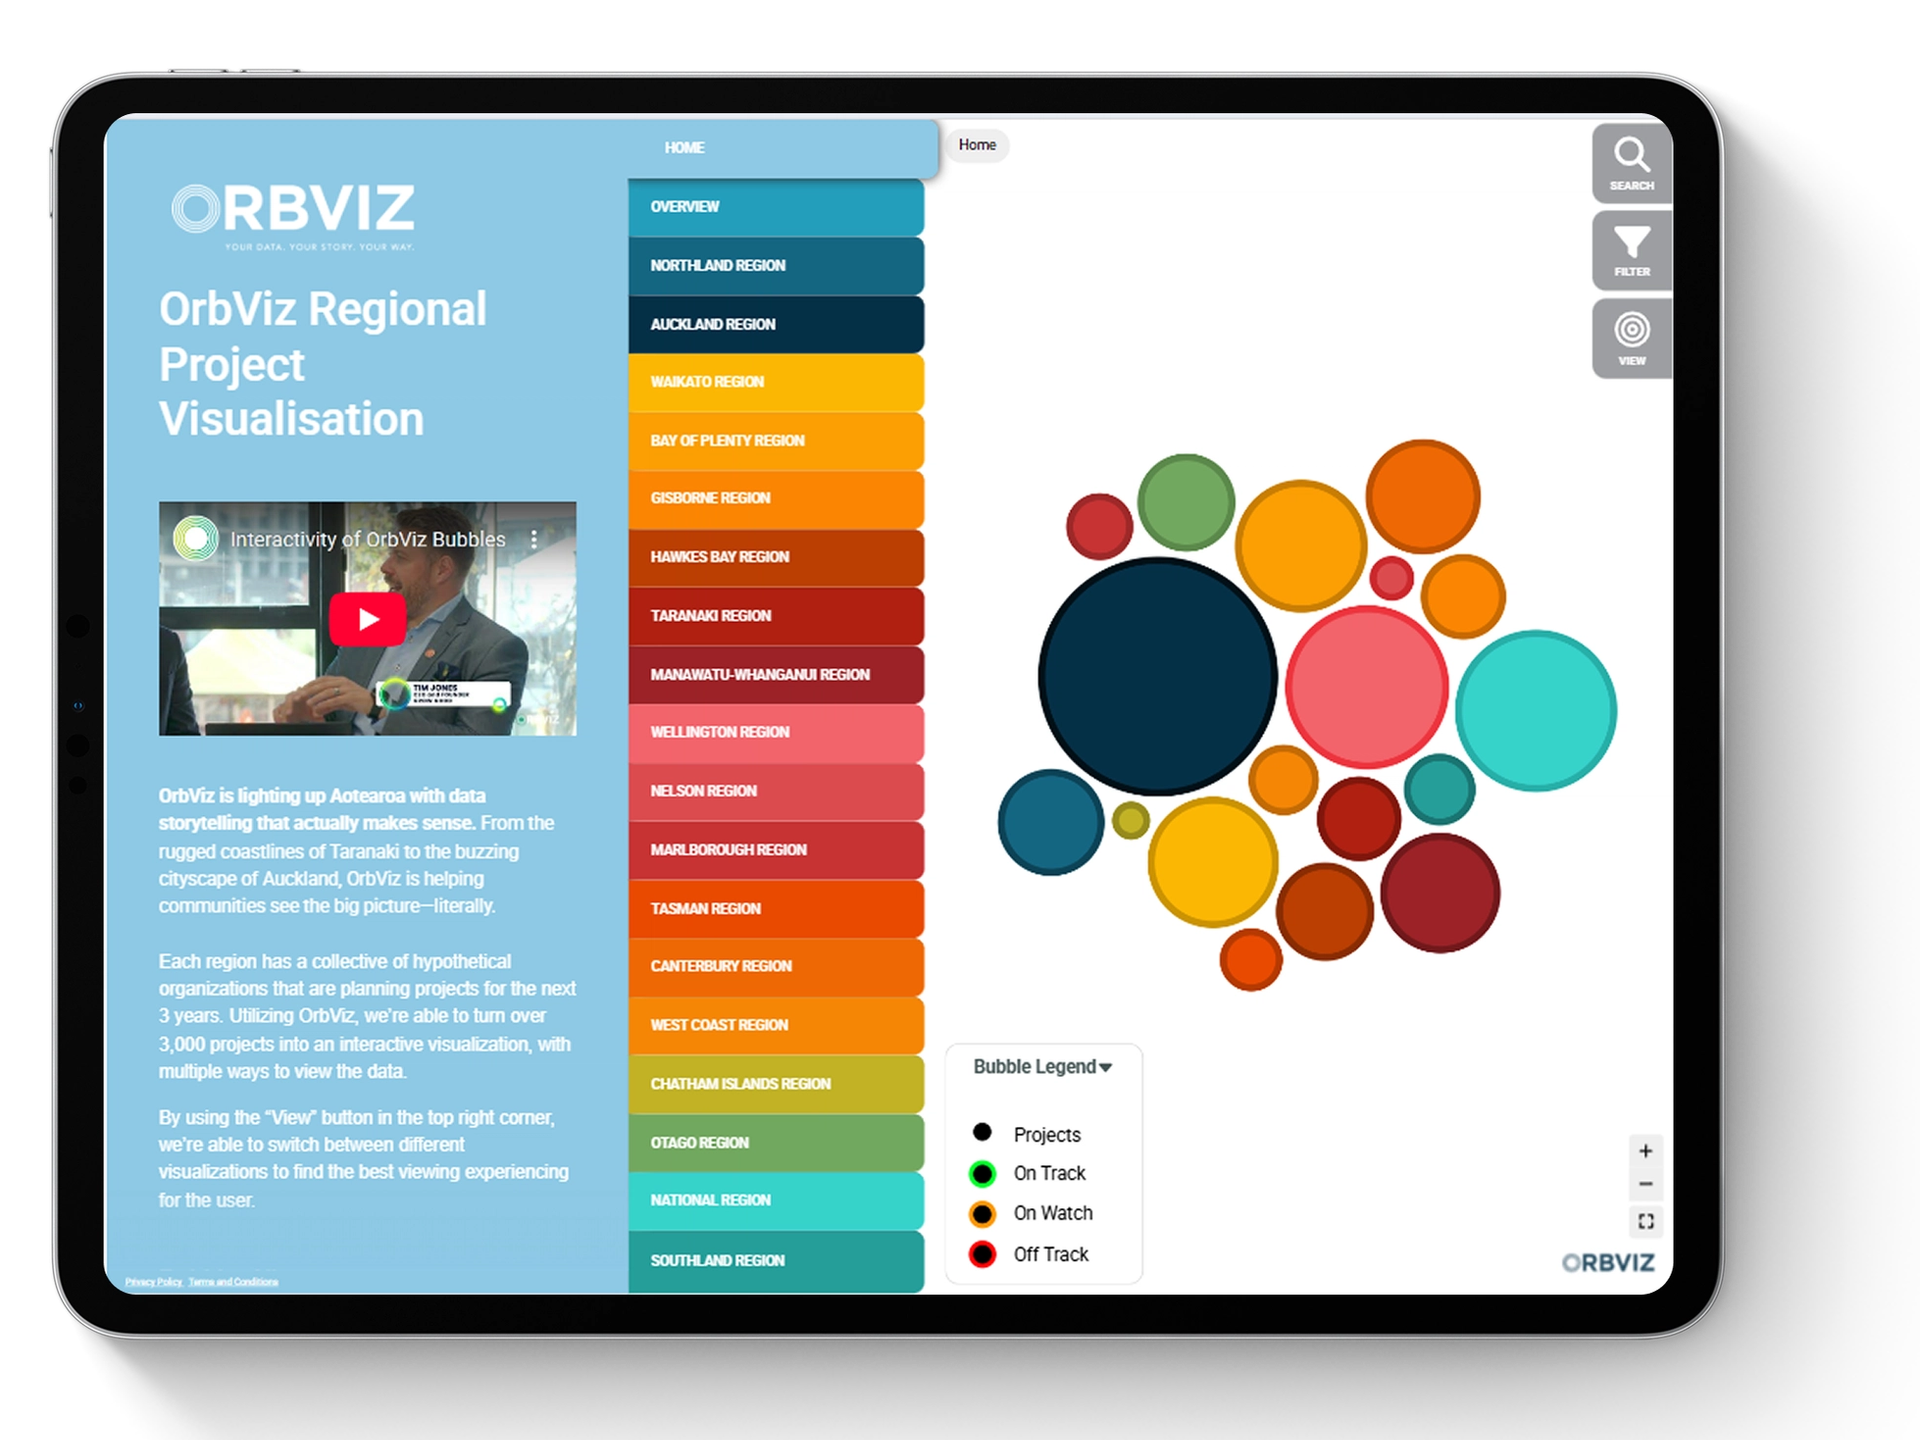
From access to convenience
Save time and confusion by getting your stakeholders on the same (digital) page: present your disparate project information in one easy-to-understand and update report.
Use Case 5:
Enterprise
From report to results
Consolidate your complex data and reports into an easy-to-navigate and explore digital experience for your stakeholders. Engage and collect feedback to inform decision making.