OrbViz Product Features
OrbViz turns your static reports into interactive dashboards with customisable charts, feedback tools, and beautiful visualisations, helping you present your data and engage stakeholders in ways you couldn’t do before.
Discover how OrbViz can transform your reports.

From Spreadsheets to Instant Insights
Elevate your report presentations and unlock new perspectives with Orbviz’s dynamic visualisations. Present your data in ways that inspire understanding and drive action.
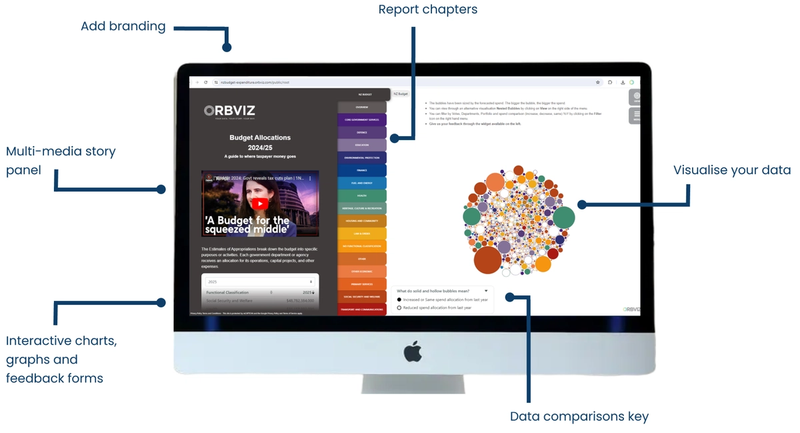
Bubbles: Visualise data at a glance with OrbViz's signature bubble format, where line items become bubbles sized by value and colour-coded by category.
Nested Bubbles: Group related data points into nested bubbles for a more detailed view.
Maps: Represent geographical data points, locations or service areas on an integrated map view.
Time Series: Visualise trends over time with customisable time series charts.
Comparison Bubbles: Compare datasets or scenarios side-by-side.
Halo Bubbles: Highlight critical data points with our halo feature. Track project milestones, monitor budget variances, and visualise performance trends over time.
From Line Items to Narratives
Bring your data to life by pairing each data point bubble with its own narrative. The OrbViz story panel combines text with multi-media resources, supporting visuals, and charts to allow you to tell the story of your data.
Interactive Data Bubbles: Pair each data bubble with its own narrative and supporting resources for deeper context.
Customisable Charts and Tables: Visualise comparative data, budget allocations, or trends over time.
Multi-Media: Add videos, images, links, or iFrames to enhance reports with valuable context.
Summary Table: Provide stakeholders with a high-level overview of your data for instant understanding.
Custom Tabs: Acting as your report ‘chapters’, customise tabs with colours, logos, and icons. Add as many as needed and arrange them in any order to structure your report effectively.
Stakeholder Engagement and Feedback
Engage your stakeholders with OrbViz’s integrated feedback tools.
Sentiment and Feedback: Collect valuable insights by gauging stakeholder opinions and understanding.
Stakeholder Voting System: Quickly capture preferences with a customisable voting tool.
Engagement Analytics Report: Automatically integrate feedback results into your engagement report for seamless analysis.
Unique URL: Share individual data points or the entire report effortlessly using unique URL links.
Ready to Transform Your Data Reporting?

Say goodbye to static spreadsheets and boring reports. With OrbViz, your data becomes an engaging story that drives decisions and inspires action.
Get started today